A list of relevant publications from the NNdb.
A ‘Naturalistic Neuroimaging Database’ for understanding the brain using ecological stimuli.
Authors: Sarah Aliko, Jiawen Huang, Florin Gheorghiu, Stefanie Meliss, Jeremy I Skipper
Please cite the above paper if you would like to use the NNDb. Get in touch if you have questions or would like to discuss a collaboration.
Below are some figures from our paper.

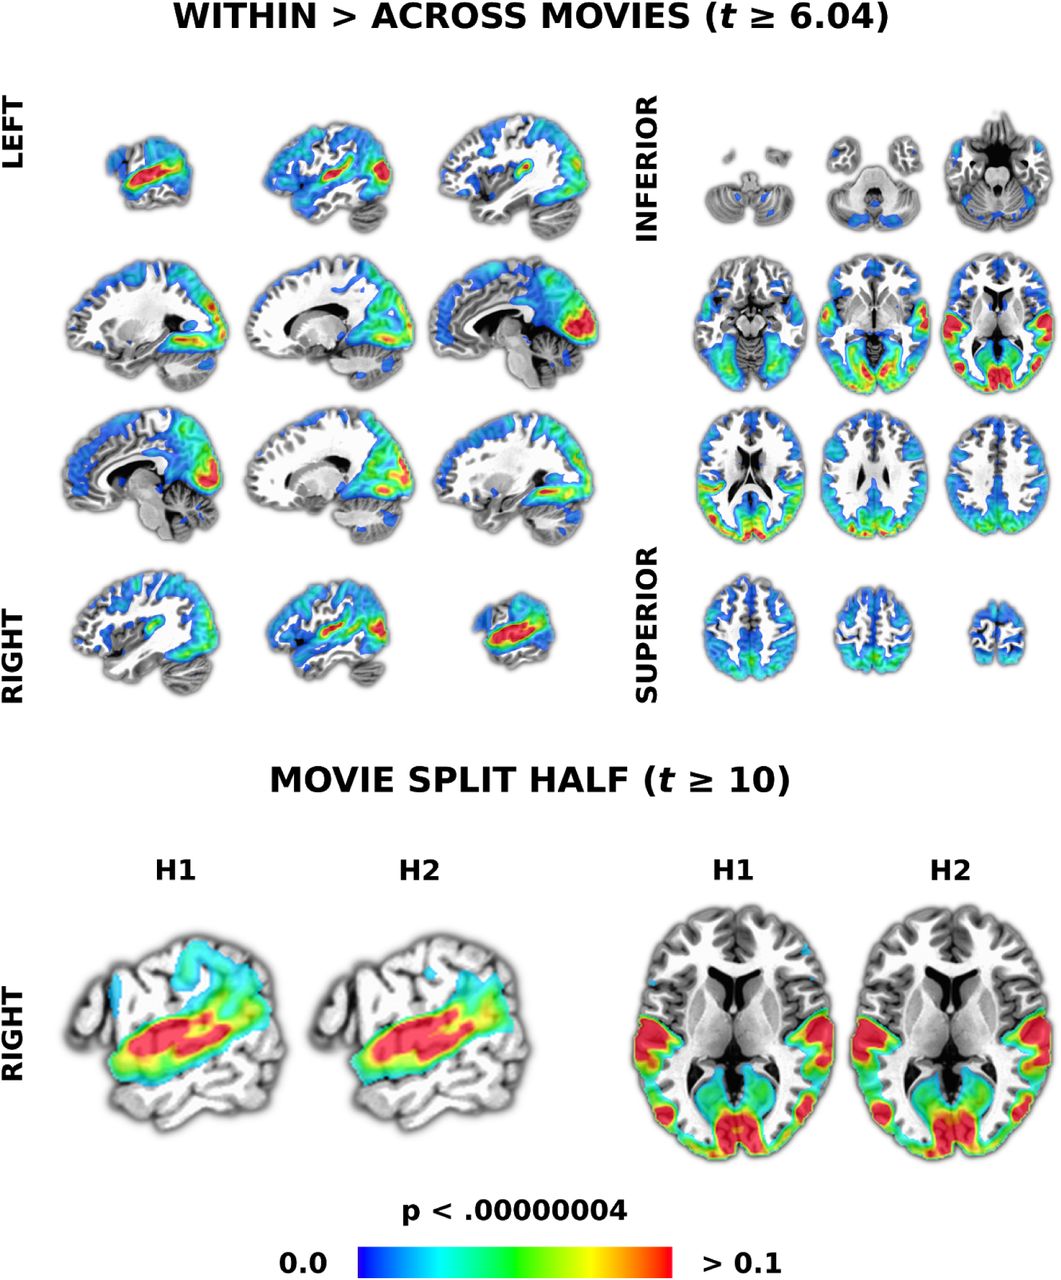
Results of intersubject correlation (ISC) demonstrating data quality and timing synchrony between participants and movies. ISC is a data-driven approach that starts with calculating the pairwise correlations between all voxels in each pair of participants. We used a linear mixed effects with crossed random effects (LME-CRE) model to contrast participants watching the same versus different movies (top). Equally-spaced slices were chosen to be representative of results across the whole brain. To demonstrate reliability, we split the data in half, with each having five different movies. The same LME-CRE model was run on each half and the results are presented at an arbitrary threshold to more easily view similarities and differences (bottom row). Slices were chosen to make differences more salient. The colour bar represents correlation values (r) in all panels. All results are presented at a p-value corrected for multiple comparisons using a Bonforoni correction and an arbitrary minimum cluster size threshold of 20 voxels.

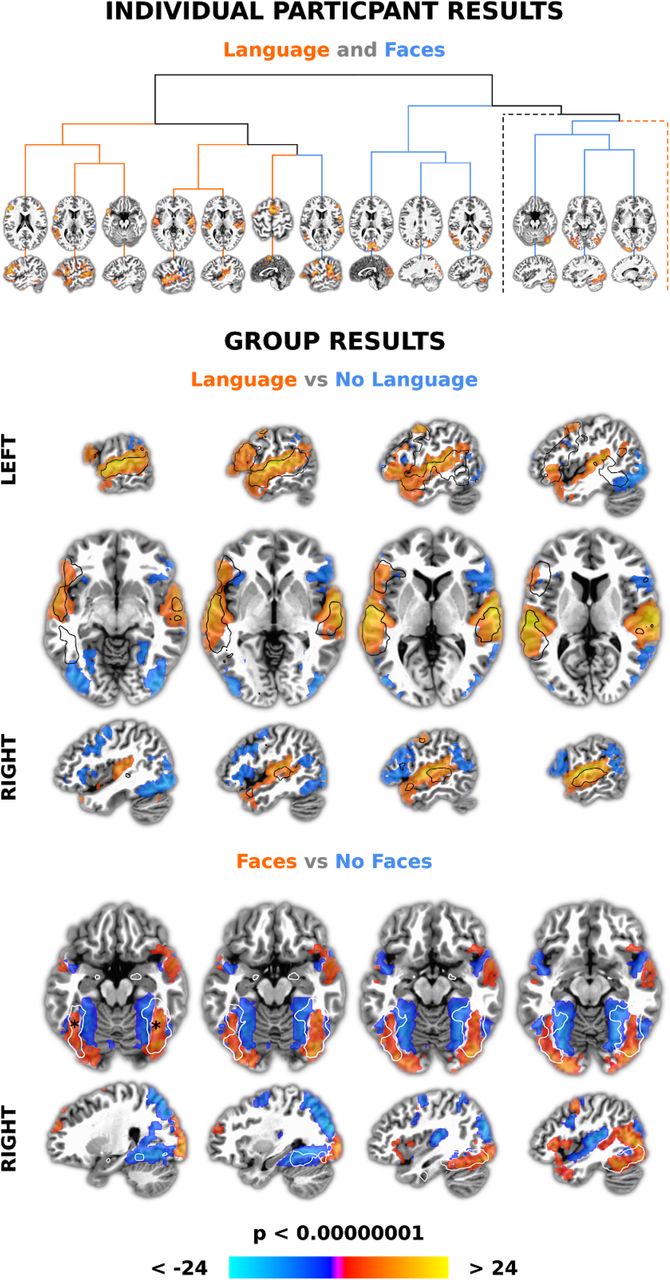
Results of combined independent component analysis (ICA) and model-based analysis demonstrating data quality, timing accuracy and an approach to network labelling. First, networks were found at the individual participant level using ICA, a multivariate data-driven approach. Word and face annotations from movies were then convolved with a standard hemodynamic response function and used in general linear models to find associated IC timecourses. The dendrogram (top) shows 13 of 20 significant networks from an example participant that were more associated with words > no words (‘Language’; red lines) and faces no faces (‘Faces’; blue lines), clustered to show IC timecourse similarity. Slices are centred around the centre of mass of the largest cluster in each network. Two branches (dotted lines) were excluded for visibility. These had an additional five language and two face networks. For group analysis, spatial components corresponding to significant IC timecourses for each participant were summed and entered into t-tests. The middle panel shows that word > no word networks (‘Language’; reds) overlap a ‘language’ meta-analysis (black outline) more than no word > word networks (‘No Language’; blues). Slices are centred around the centres of mass of the two largest clusters, in the left and right superior temporal plane. The bottom panel shows that face > no face networks (‘Faces’; reds) produced greater activity than no face face networks (‘No Faces’; blues) in the same areas as a ‘fusiform face’ area (FFA) meta-analysis (white outline). Slices are centred near the average x/y/z coordinates of the putative left and right FFA (indicated with black asterisks). The colour bar represents z-scores in all panels. All individual and group level results were Bonforoni corrected for multiple comparisons and presented with an arbitrary minimum cluster size of 20 voxels.